Are Corona-Warn-App users more cautious? – Behavioral data from Germany
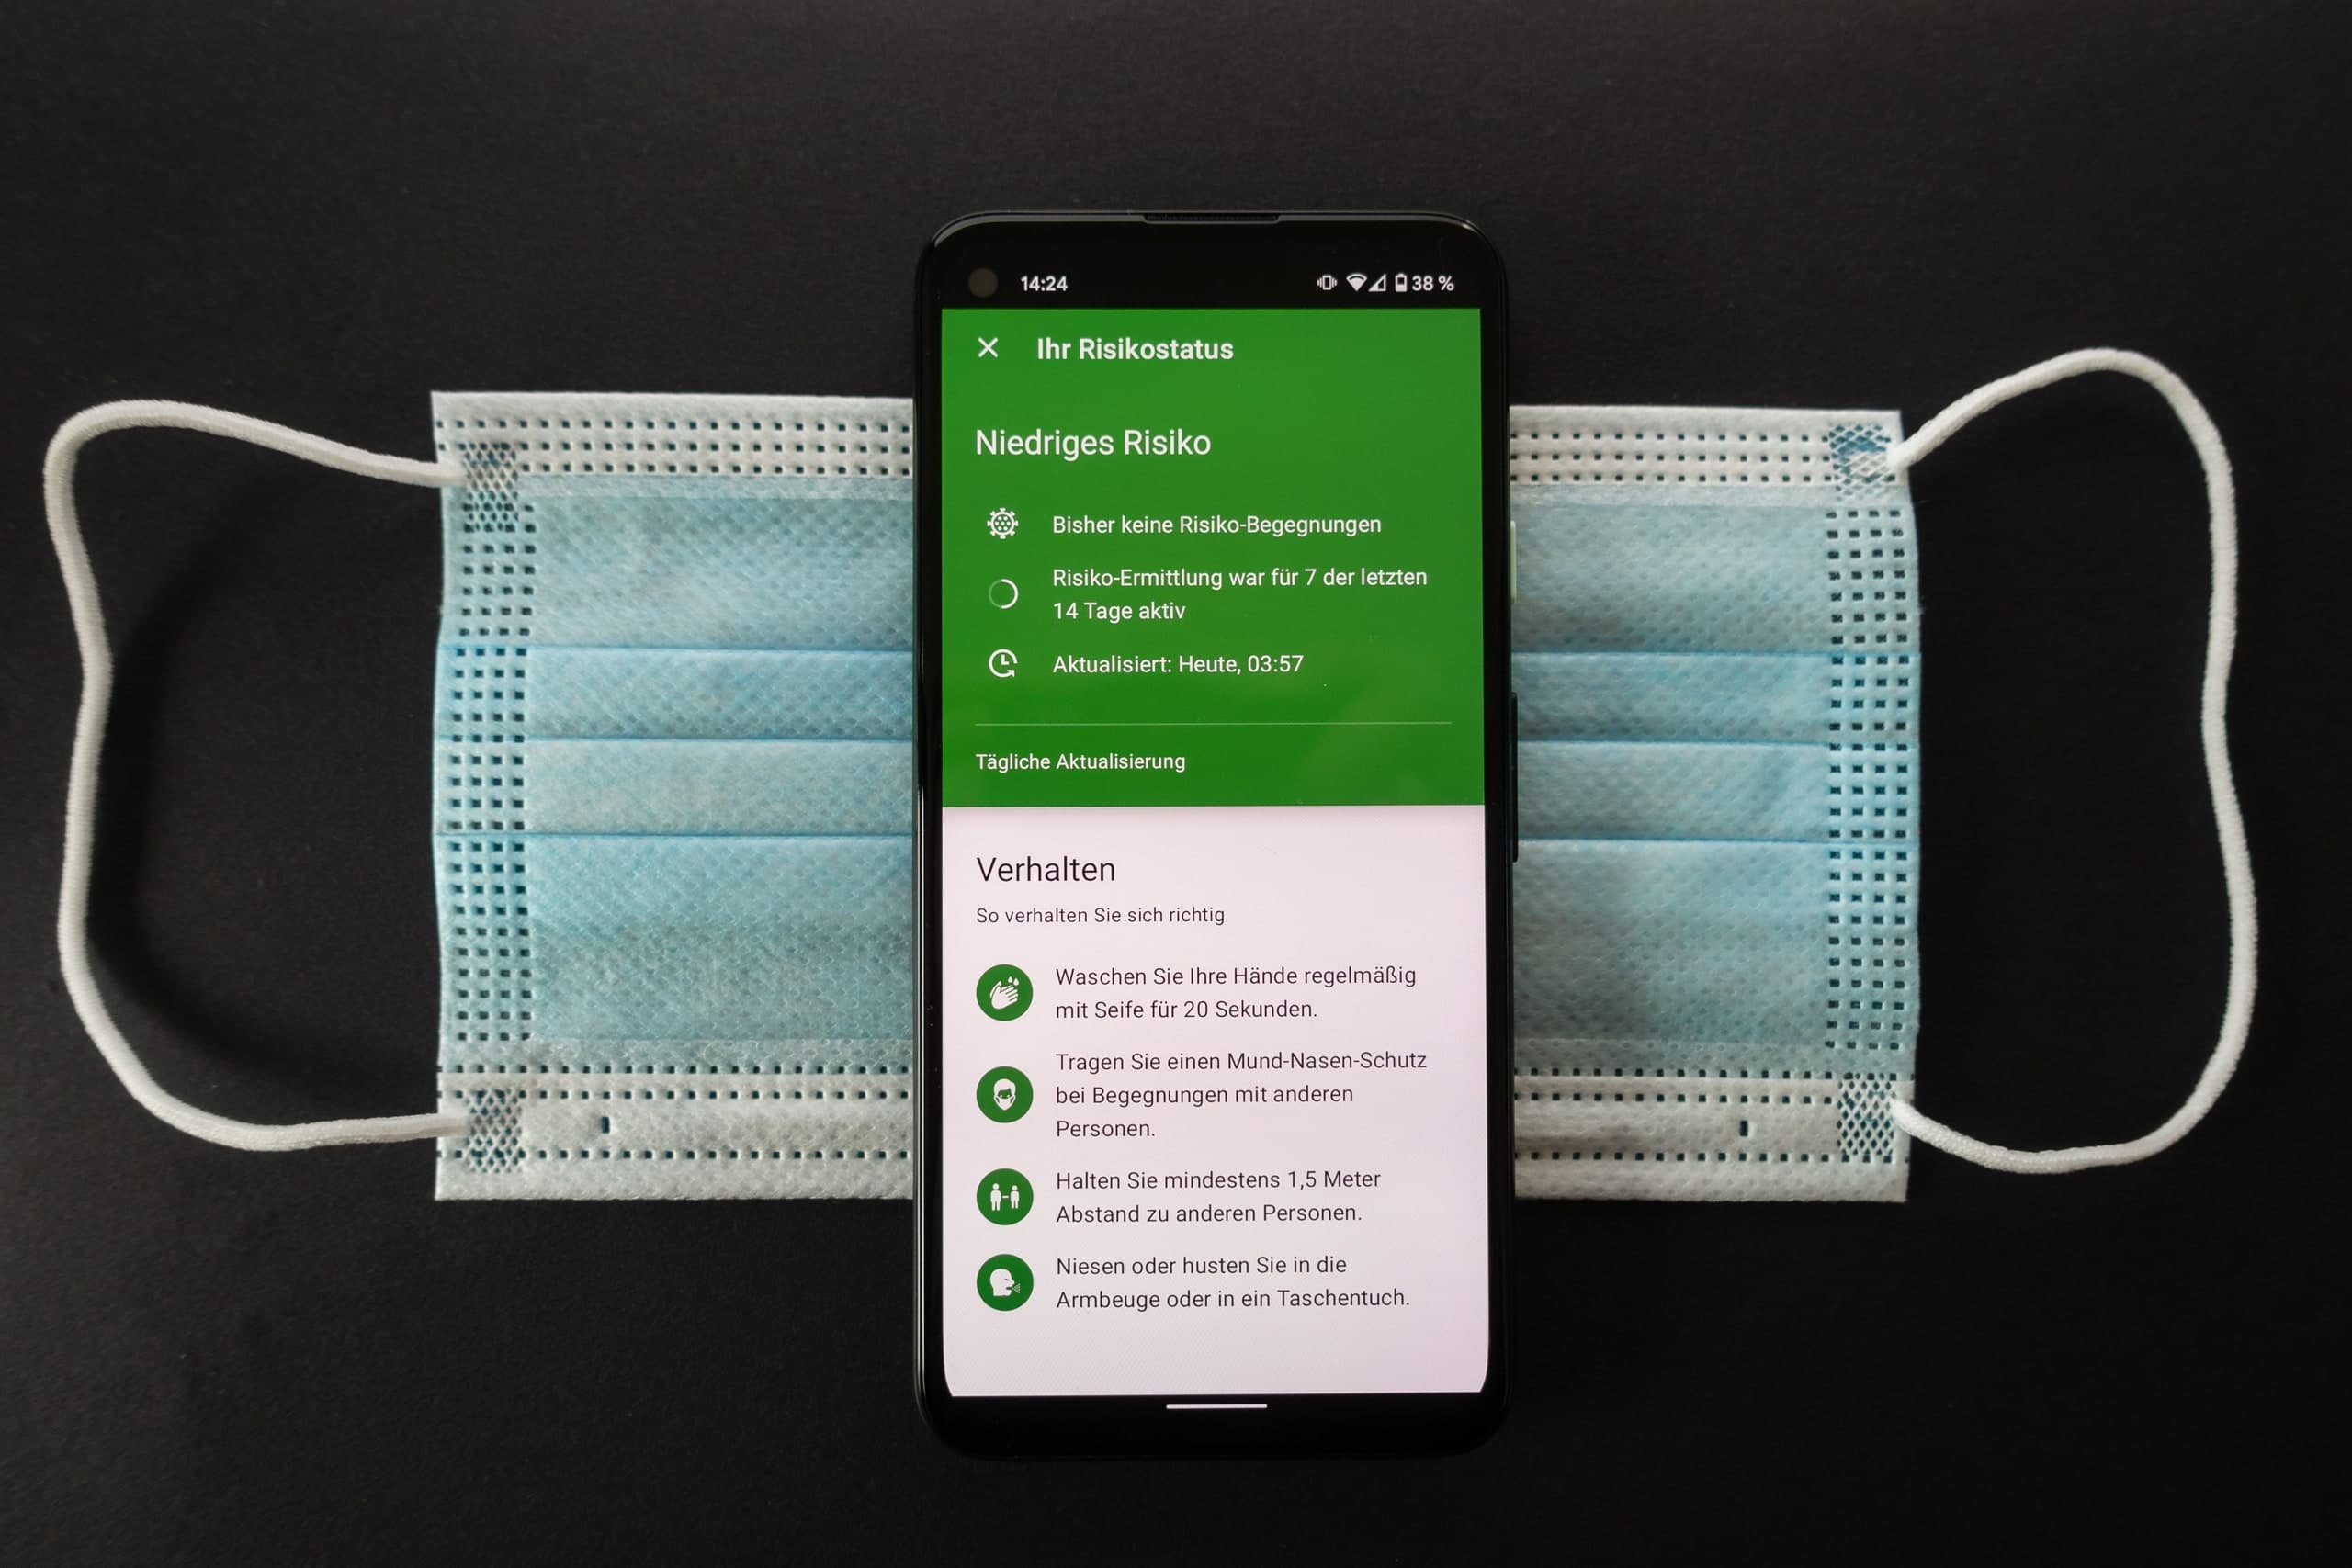
Smartphone apps are supposed to play a key role in fighting the spread of coronavirus. Infections can be traced back and further spread may be prevented by alerting users who were in contact with a person tested positive. Germany's state-developed Corona-Warn-App has been downloaded more than 21 million times. The efficacy of the app depends on its number of users. According to an Oxford study, in order to completely suppress the pandemic, 56% of the population need to use the app. But even at a lower app adoption rate, as long as more than 15% of the population use the app, infections and deaths can be prevented. Germany has 83.2 million citizens, which means only 25% of the population have downloaded the app.
To convince the remaining 75% to download Corona-Warn-App, it is crucial to understand who is actually using the corona app? What differentiates their behavior from those who don’t?
We analyzed mobility behavior and digital smartphone behavior of users of CoronoWarnApp vs non-users. Which group travels more? Is it plausible that corona app users differentiate themselves from non-users through high smartphone affinity? Who is using more social & communication apps? Who is consuming passive apps such as videos and games?
We gathered behavioral data of 668 participants, of whom 290 had installed the corona app. Data was collected from July to September 2020 in Germany with test persons' consent. We analyzed mobility behavior two-fold: daily distance traveled, and diameter of daily travel area. Second, we looked at overall smartphone usage and individual app usage duration by app category.
How corona app users behave
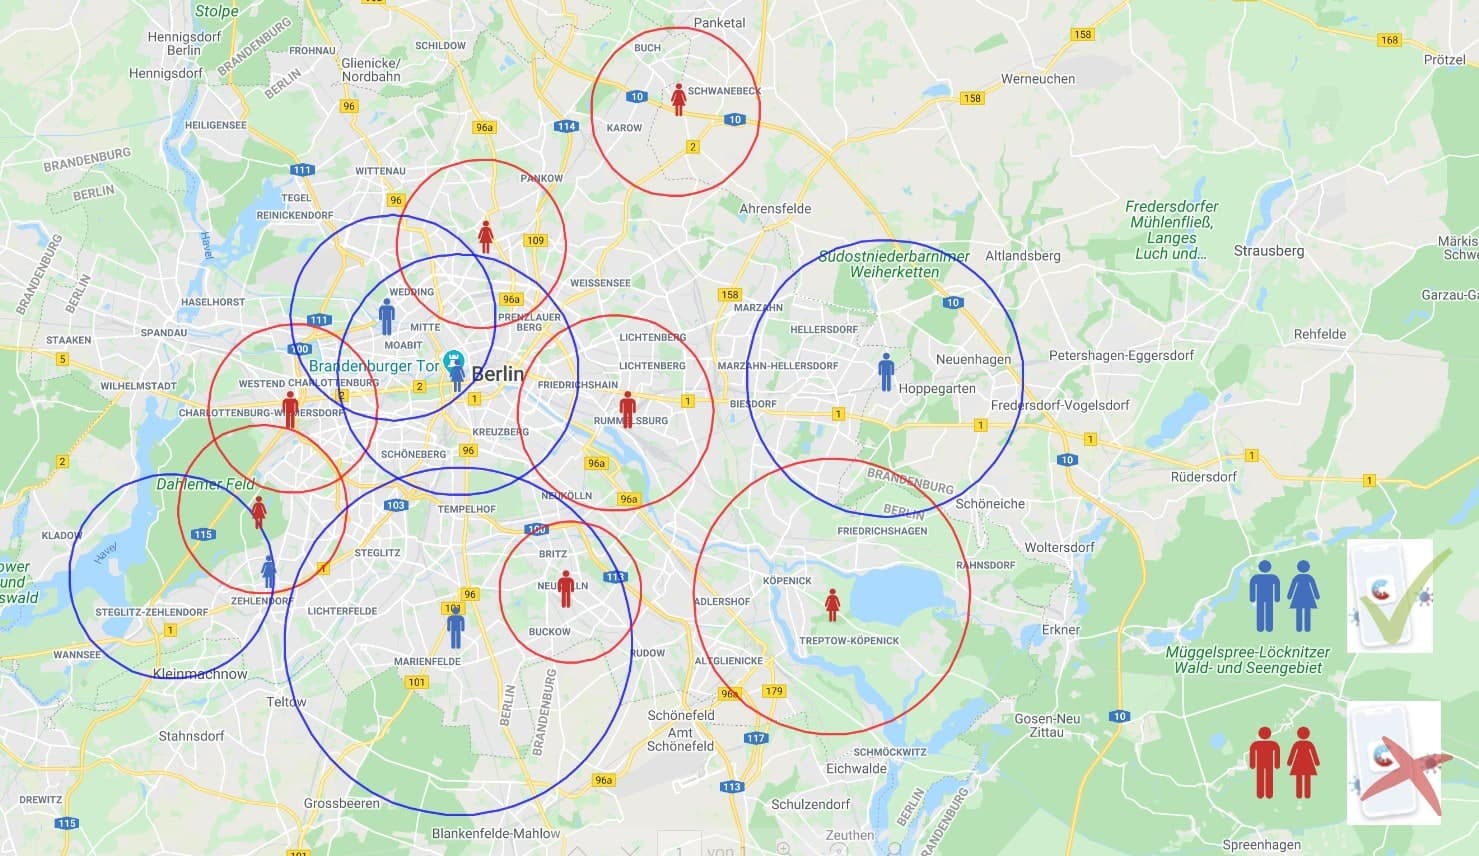
To compare mobility behavior of people with and without corona app, we analyzed data points sent by their smartphones throughout the day. When looking at the average distance travelled per day, corona app users travelled about 4 km further than non-users (sum of all means of transport and on foot).

Apart from the total daily distance, we analyzed activity diameter within which a person moves in a day. We defined this as the distance between the two furthest apart locations in a day. A small diameter of 1 km might imply a person only stayed in their neighborhood, in close proximity to their home. In our sample, corona app users spent 22% of their time within a diameter of 1 km. In comparison, non-users did so on 29% of days. Users without Corona App also made fewer trips longer than 20km.

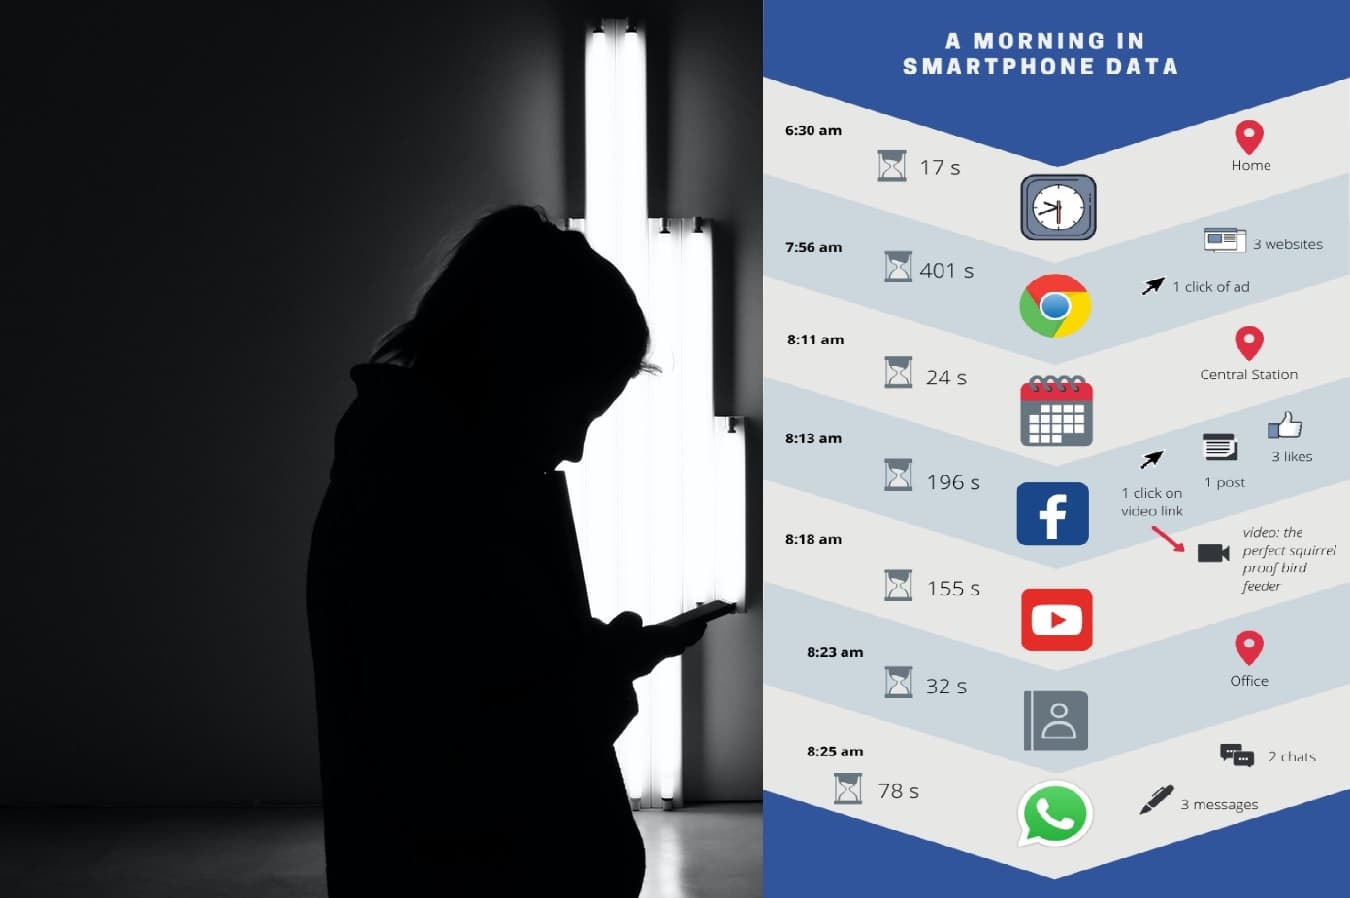
We also analyzed digital behavior of corona app users. People with corona app used their phones on average 5 min longer per day (3:44 hours vs 3:49 hours). Non-users spent slightly more time in communication apps (e.g. WhatsApp) and social apps (e.g. Instagram), 110 min daily average to 106min daily average. On the other hand, corona app users on average spent a bit more time playing games or watching videos (47 min to 45min).

What the results tell us
It has to be noted that our sample predominantly consisted of people below 35 years of age and slightly more women than men. While it is not a representative sample, our results still have interesting conclusions that should be further investigated:
-
Our results on mobility behavior indicate that Corona-Warn-App users are not more careful, as they do spend fewer days close to their place of residence and also cover a higher average daily travel distance than non-users. The real-time risk estimation might give them a feeling of control and safety which makes them to act less cautious. On the other hand, people who tend to travel less might not see the need to download the corona app.
-
We have found that people without corona app use communication and social media apps more, even though they use their smartphone less in comparison to corona App users. This could indicate that non-users make fewer in-person visits and prefer digital communication with other people, and therefore may not see a personal benefit from downloading corona app. More advertising for the corona app on these platforms could increase the number of downloads and the effectiveness of the app.
About the author
Clara Vetter
Related Posts
What smartphone data reveals about human behavior - Opportunities for academic researchers
As constant companions, smartphones provide unique insights into people's daily lives and behaviors. While big tech companies have been using these insights for over 10 years, the method is only now emerging in the academic world. But what exactly can be measured with smartphone data? Which academic researcher can actually benefit from using this method? And what about data privacy?
Smartphone behavior during the Corona pandemic - Real app usage data from Germany.
To get a better understanding of how the corona pandemic has impacted people’s lives during lockdown, we looked at smartphone behavior. Here, we describe how real-time app usage of 755 study participants from Germany has changed. We found several interesting trends when looking at the collected data since January 2020.
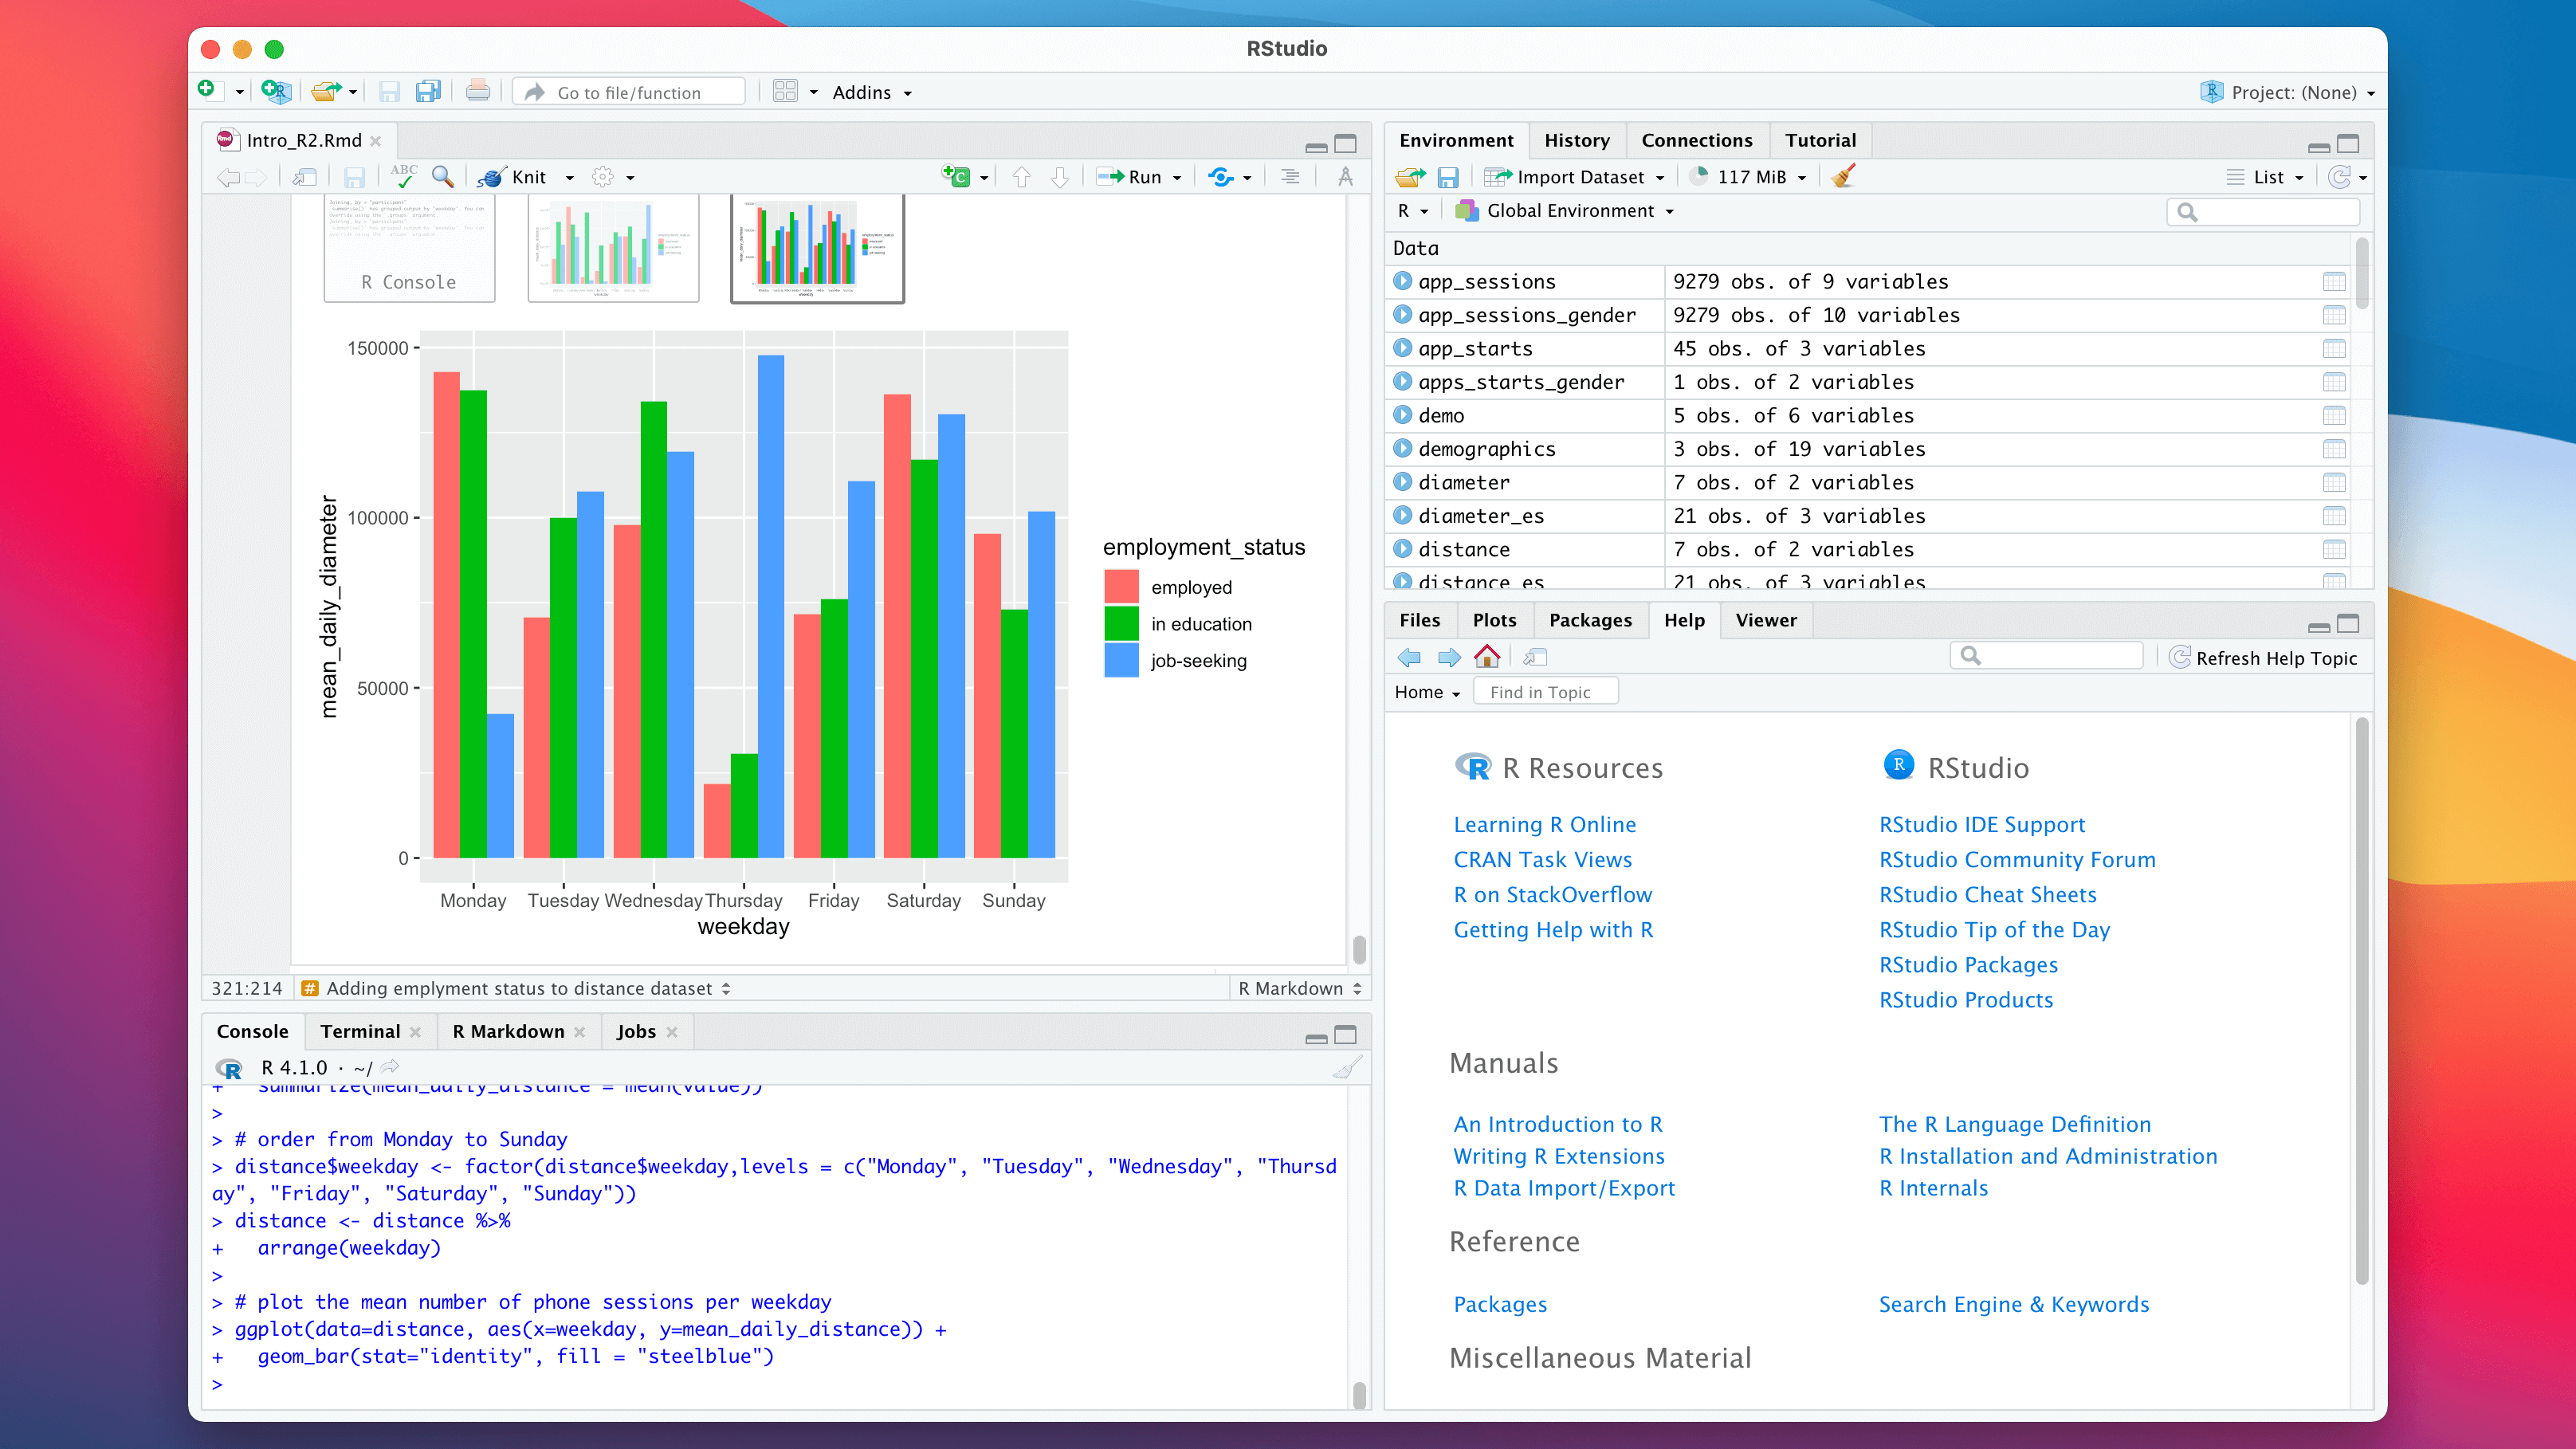
Analyzing smartphone usage data with R - Part 2: Long Format
In part 2 of our tutorial series, we show you how to analyze long format smartphone usage data from the Murmuras Platform in R. You will learn to compute mean phone usage, average phone sessions per day, mean app usage durations, and more. You will also gain insight in basic processing of location data, and comparing mobility behavior of students and employed people.